
Pepsico
Manufacturing Labor Tool
Role
Senior Product Designer
Deliverables
Research Report, Wireframes, Interactive Prototypes, Hi-Fi Designs
Activities
I led the design of the Manufacturing Labor tool, aligned with PepsiCo's Design System, and conducted user research, interviews, and testing to refine the project. I presented insights to Global Directors, shaped User Stories, and created high-fidelity prototypes for effective solutions.
Overview
The Pepsico's Manufacturing Labor Tool is expected to be the core product for Global Small and medium-sized Pepsico factories to benchmark manning towards global standards for the four areas of manufacturing labor (Packaging, Processing, Maintenance & Reliability, and Quality Control).
Problem
PepsiCo's Manufacturing Labor processes in Packaging, Processing, Maintenance & Reliability, and Quality Control are currently facing two main issues. First, our teams lack a smooth way to share information, causing confusion and inefficiencies. Second, collecting data about our workforce from Employee Central (PEP) and Contractor (DDH) sources is time-consuming and error-prone. Additionally, we struggle to compare our actual staffing numbers to a global standard, making it hard to improve our labor strategies.
Solution
We embarked on a journey at PepsiCo to create a user-friendly Manufacturing Labor tool MVP that streamlined processes. Through automating data collection from Employee Central and Contractor sources and comparing it to a global standard enriched with tech insights, we uncovered valuable labor optimization opportunities. Our tool simplified pre-work processes, standardized roles and names, and empowered site managers, all while providing intuitive interfaces, comprehensive summaries, and collaborative features. The inclusion of dashboards and verification mechanisms further elevated overall efficiency, ensuring a seamless user experience.
Research
We interviewed four Global Managers to uncover their work processes, pain points, and opportunities. We categorized findings into Interactions, Collecting Information, Global Manager Expertise, Roles, and Tools. Notably, we identified prime areas for improvement: managing site information, time, data consistency, history, and result consolidation. We also explored their tools, challenges, motivations, and needs. By analyzing their practices, we pinpointed common pain points and successes. These insights guide our experience map creation, a vital reference for our design approach.


User Interviews
These interviews focused on the deep dive process to better understand how they are performing this activity, discover pain points and opportunities at different stages of the exercise.
Gradually build it up
Process is manual
Use Excel to present
Worried about missing something
Different names for the same role
No history
Pain points
We organized it into 5 categories: Getting site information, Time-consuming, Data Standardization, History ,Consolidate Results
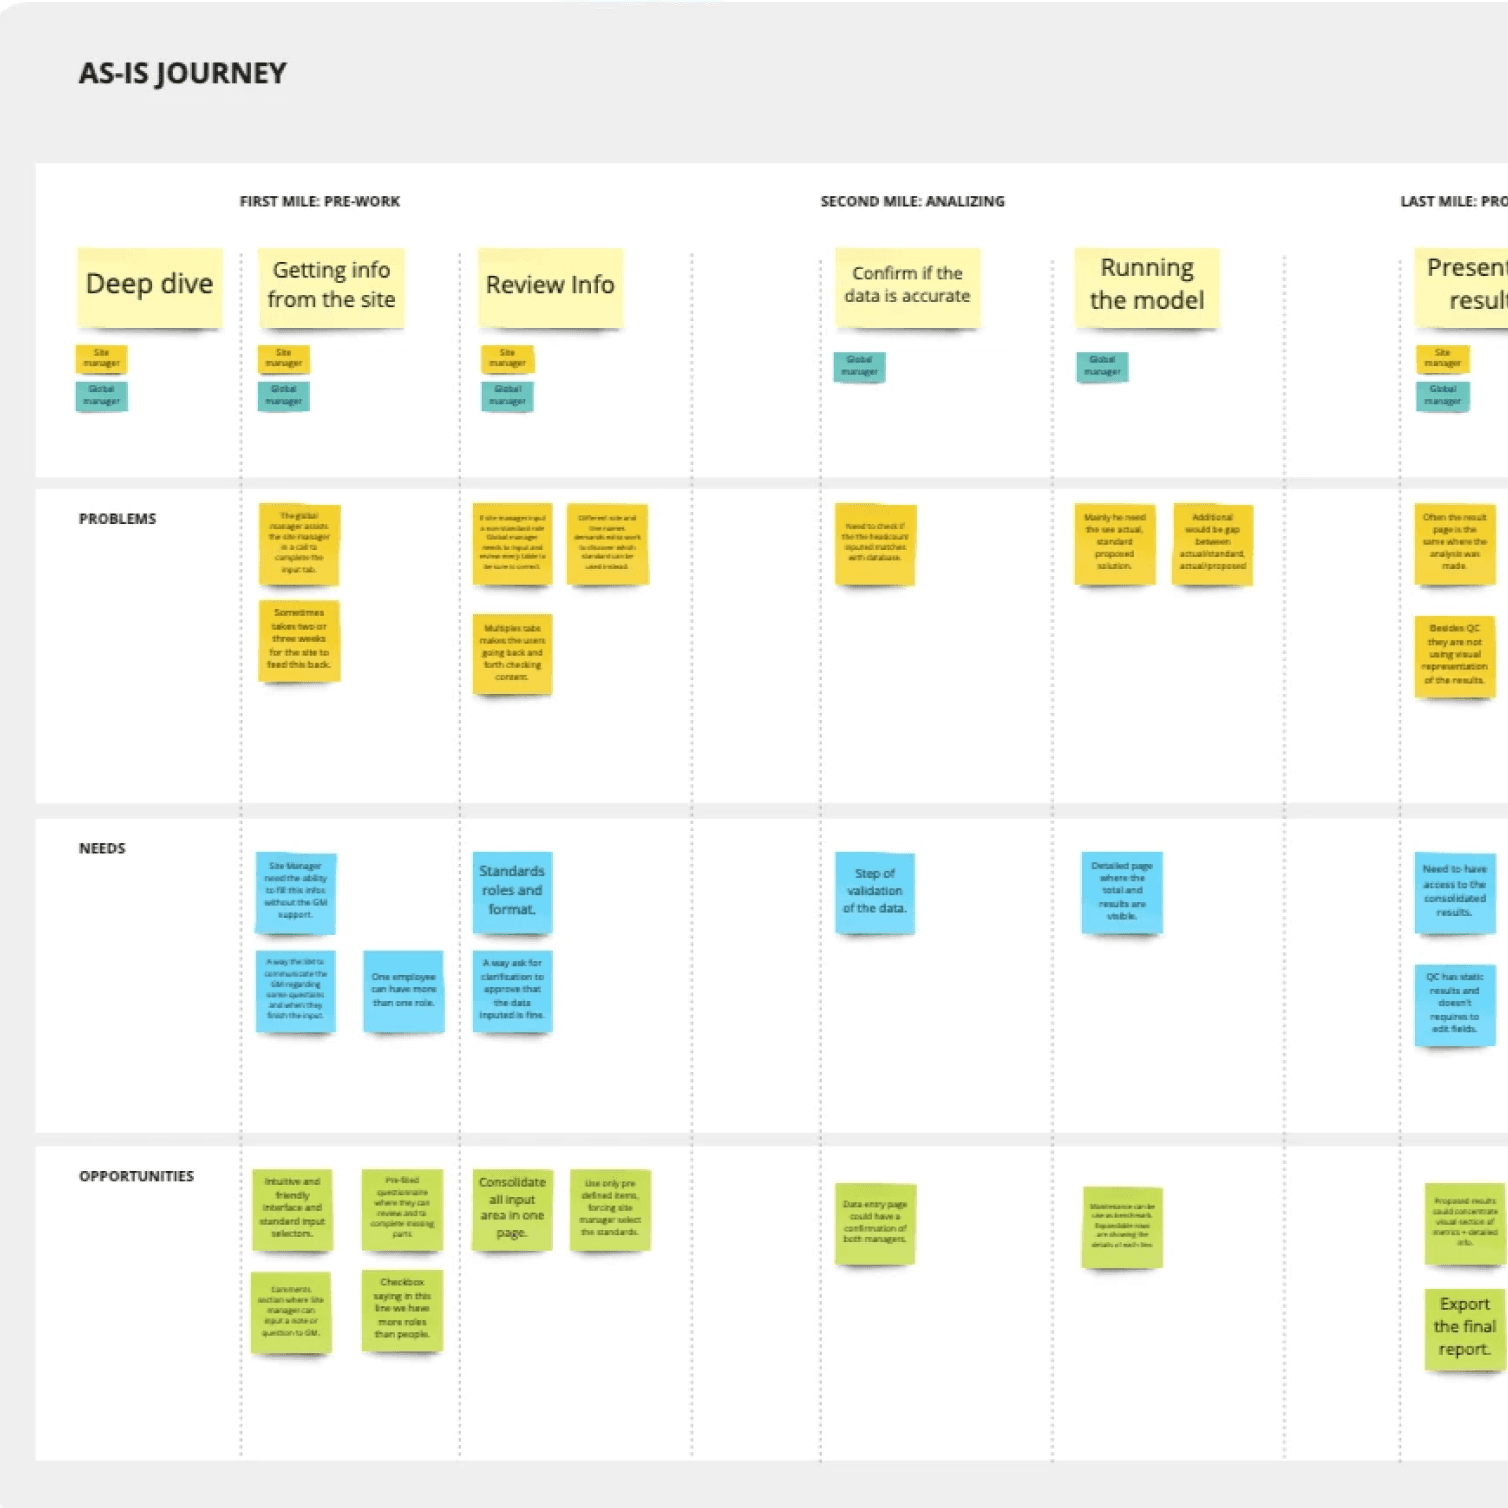
User journey
We mapped a user journey to track tasks done by each person in the process, ensuring holistic design for functional alignment.

User research summary report
We presented and delivery a repost including all the findings, potential Solutions, features and next steps
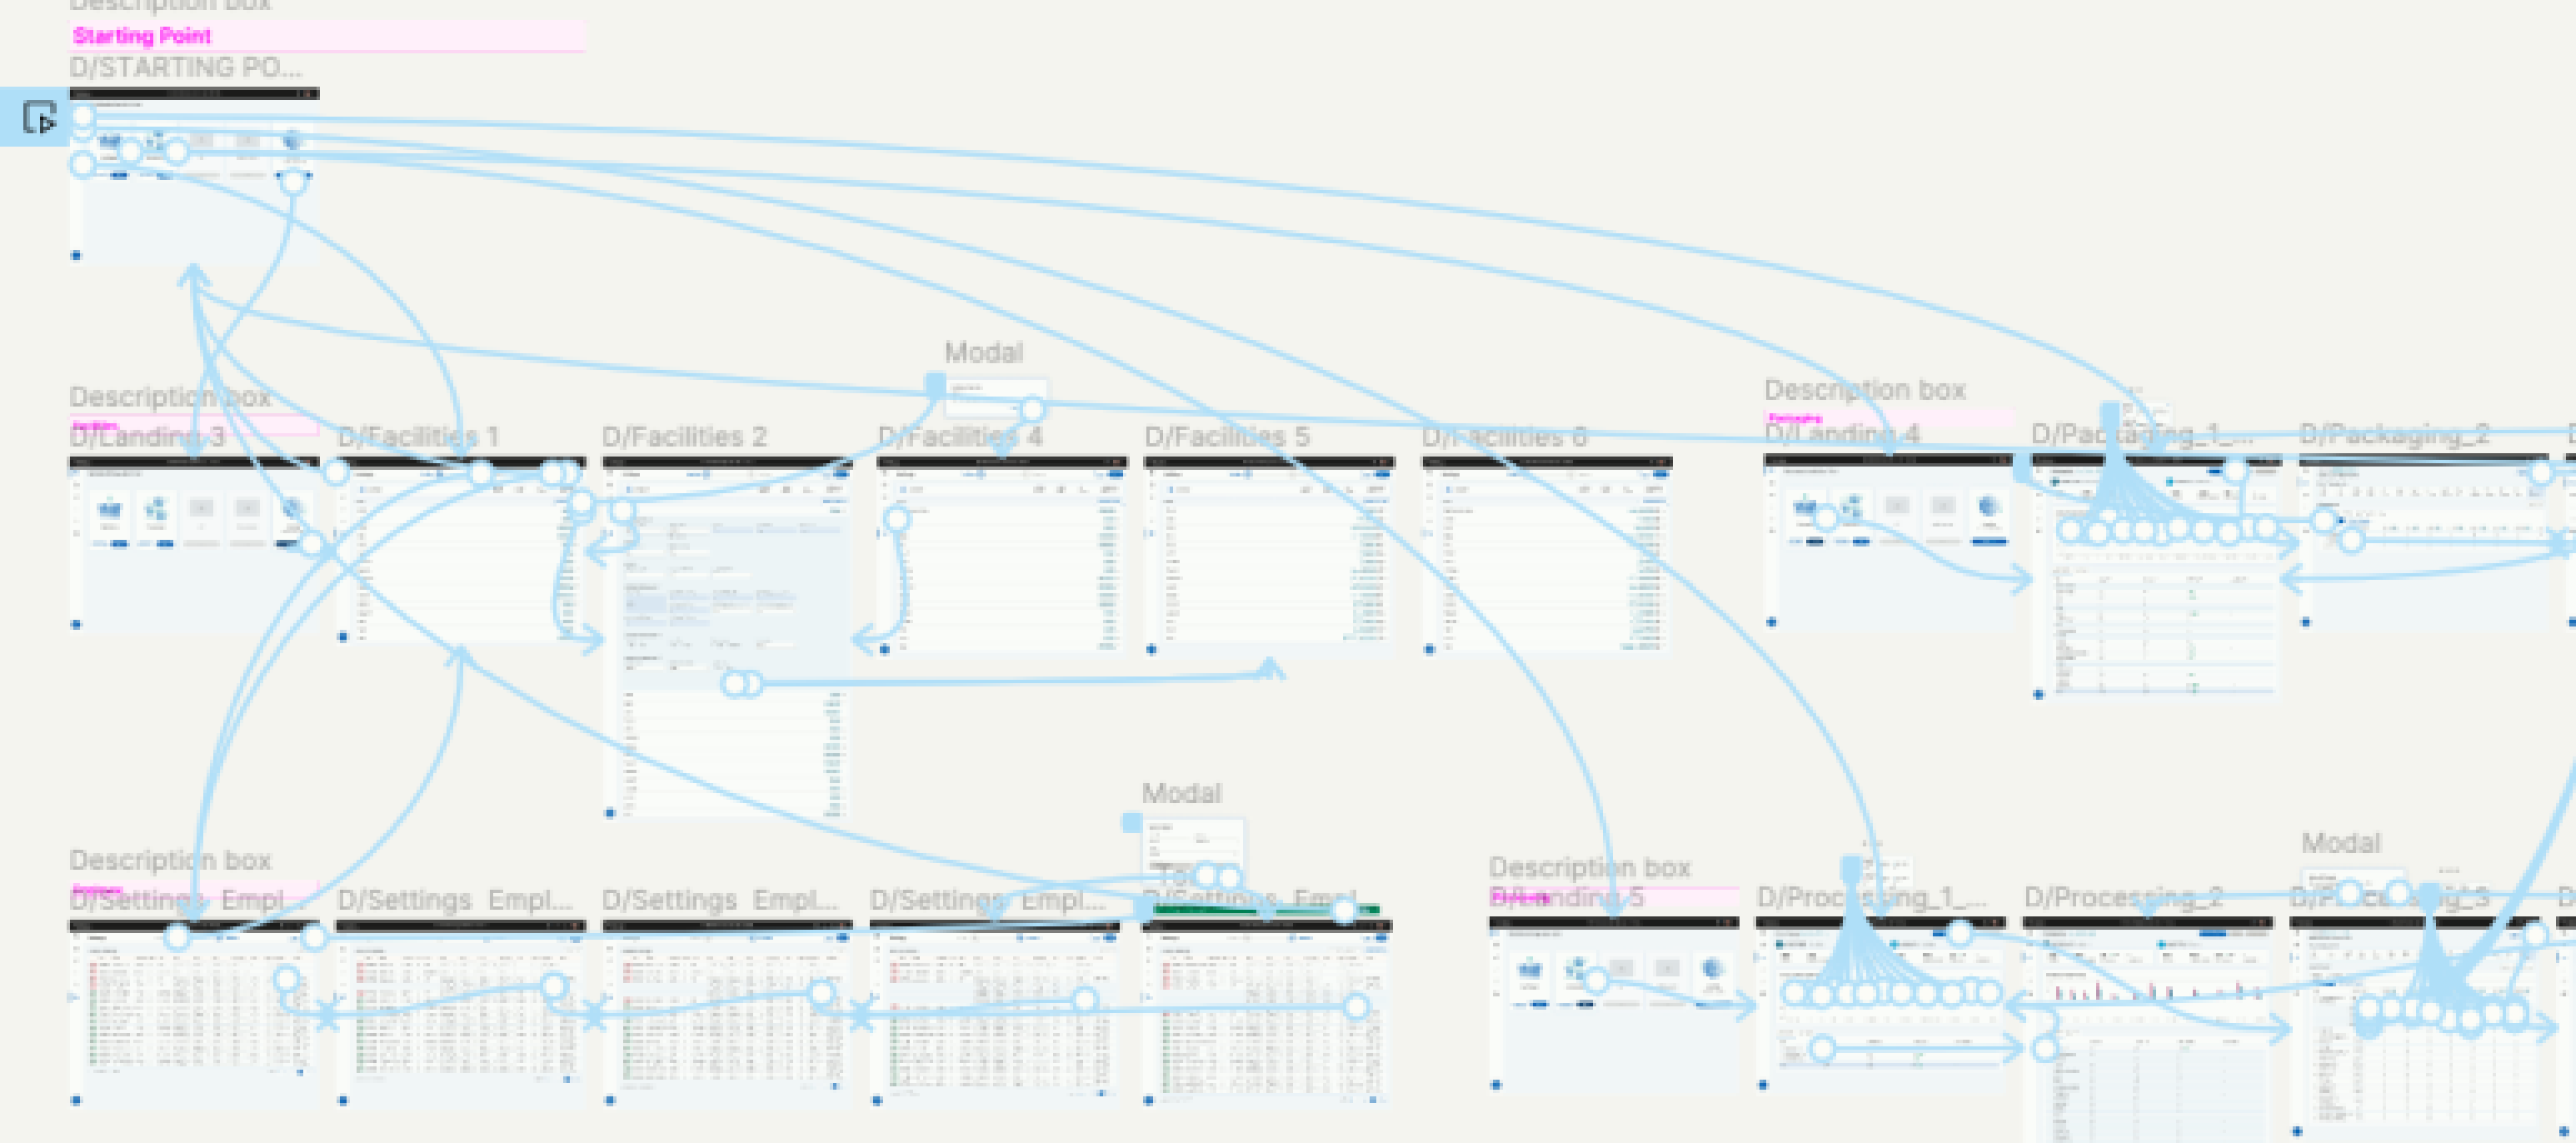
Low fidelity prototypes
Collaborating with project managers and the engineering team, we engaged in iterative discussions and testing until we were confident in the solution. Employing an interactive prototype, we conducted demos with key stakeholders for thorough assessment.
High Fidelity designs
After a few rounds of ideation, the interface I proposed focused on a sophisticated combination of color palette and design elements to provide an effortless experience for users who will spend many hours analyzing and entering values and making sure te interaction were intuitive and easy to use..
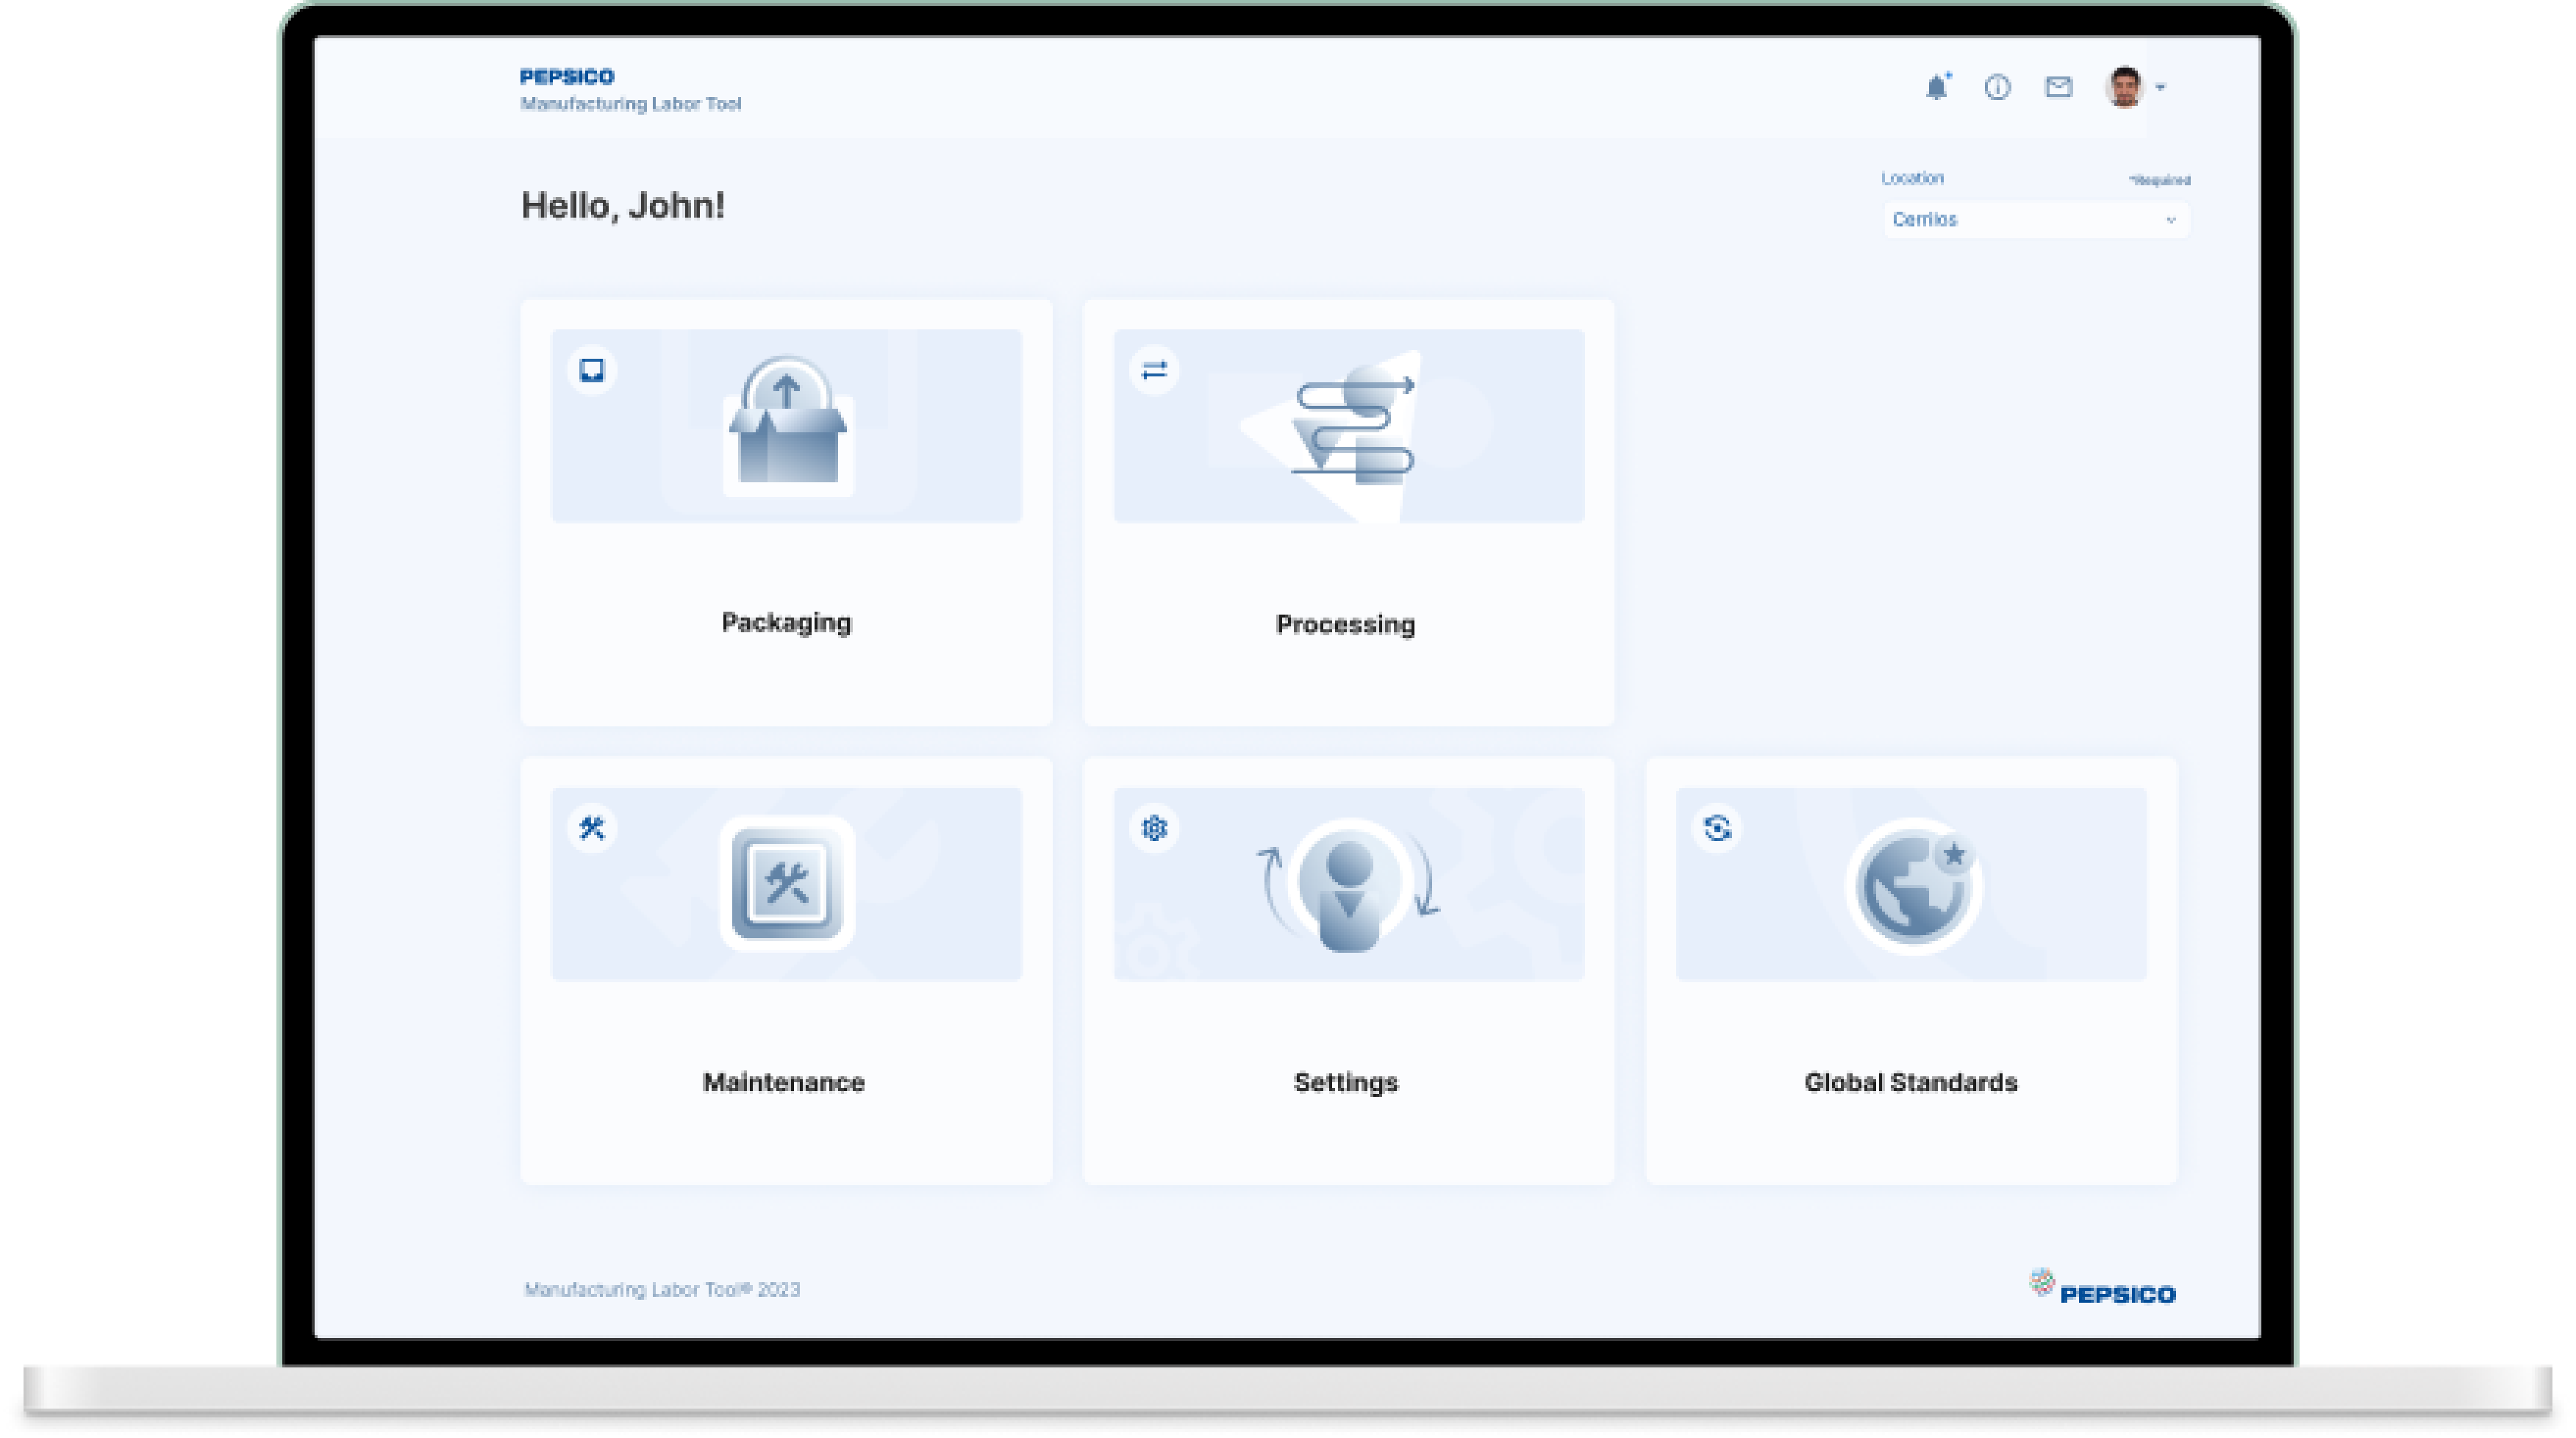
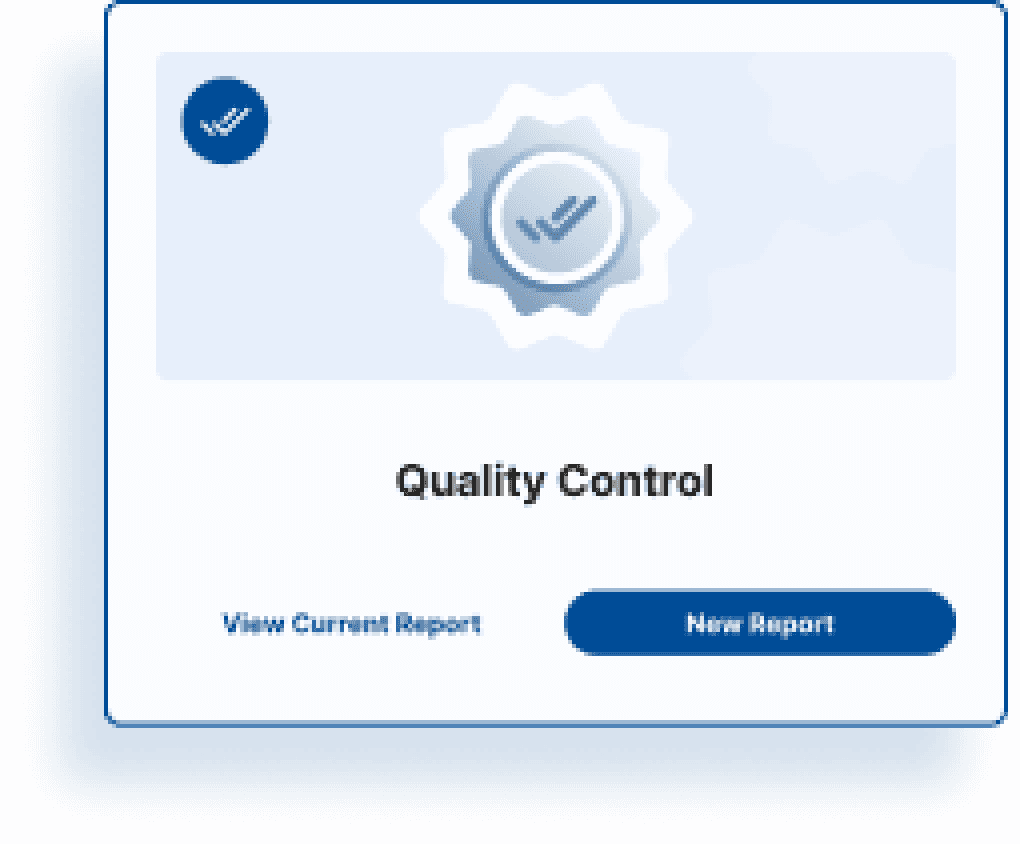
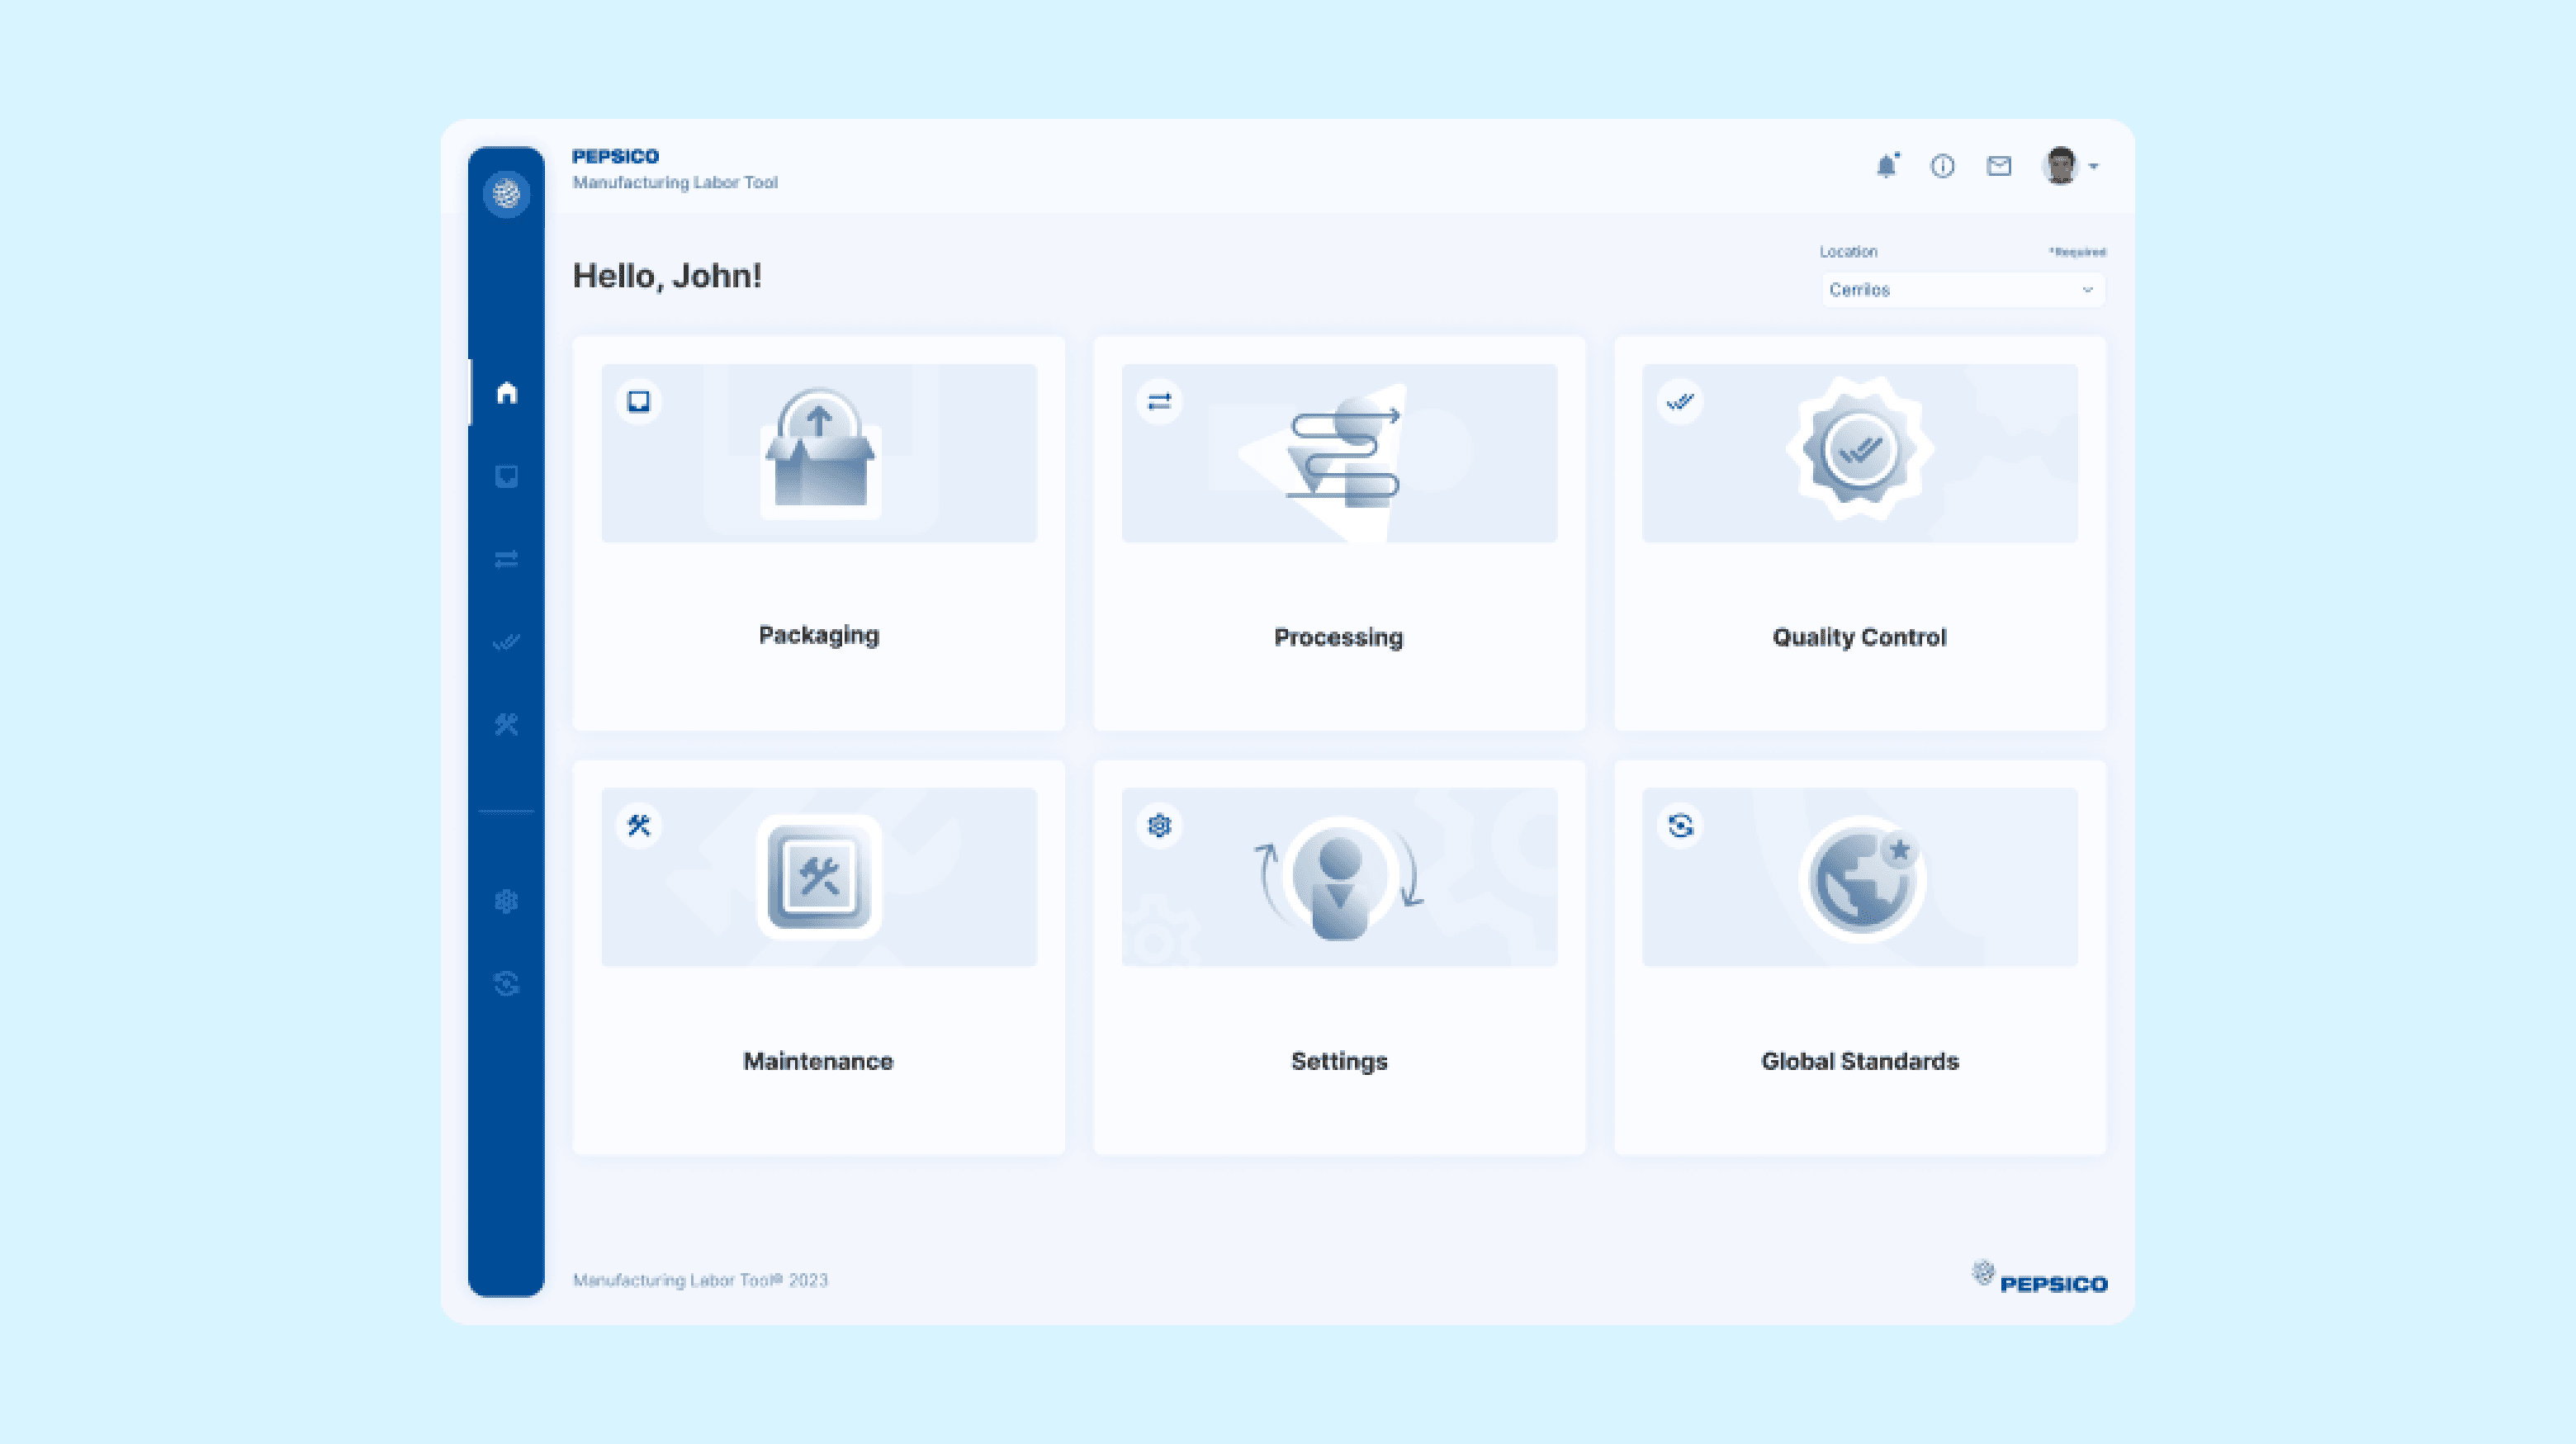
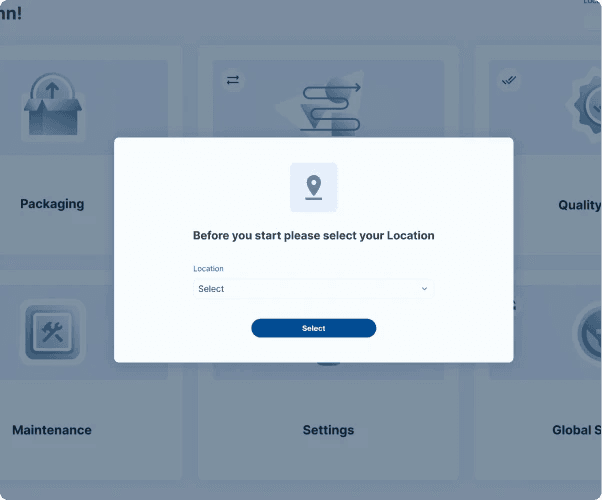
Streamlined User Experience: Seamlessly Navigate, Customize, and Monitor Manufacturing Labor Areas
Users can select one of the manufacturing labor areas to work with or update values settings and global standards. Each section has been given a custom illustration, and the left-side menu lets you switch between them at any time. First-time users get a modal to select the manufacturing site location they will be working on. On hover, the cards show the option to start a new report or check the current one.
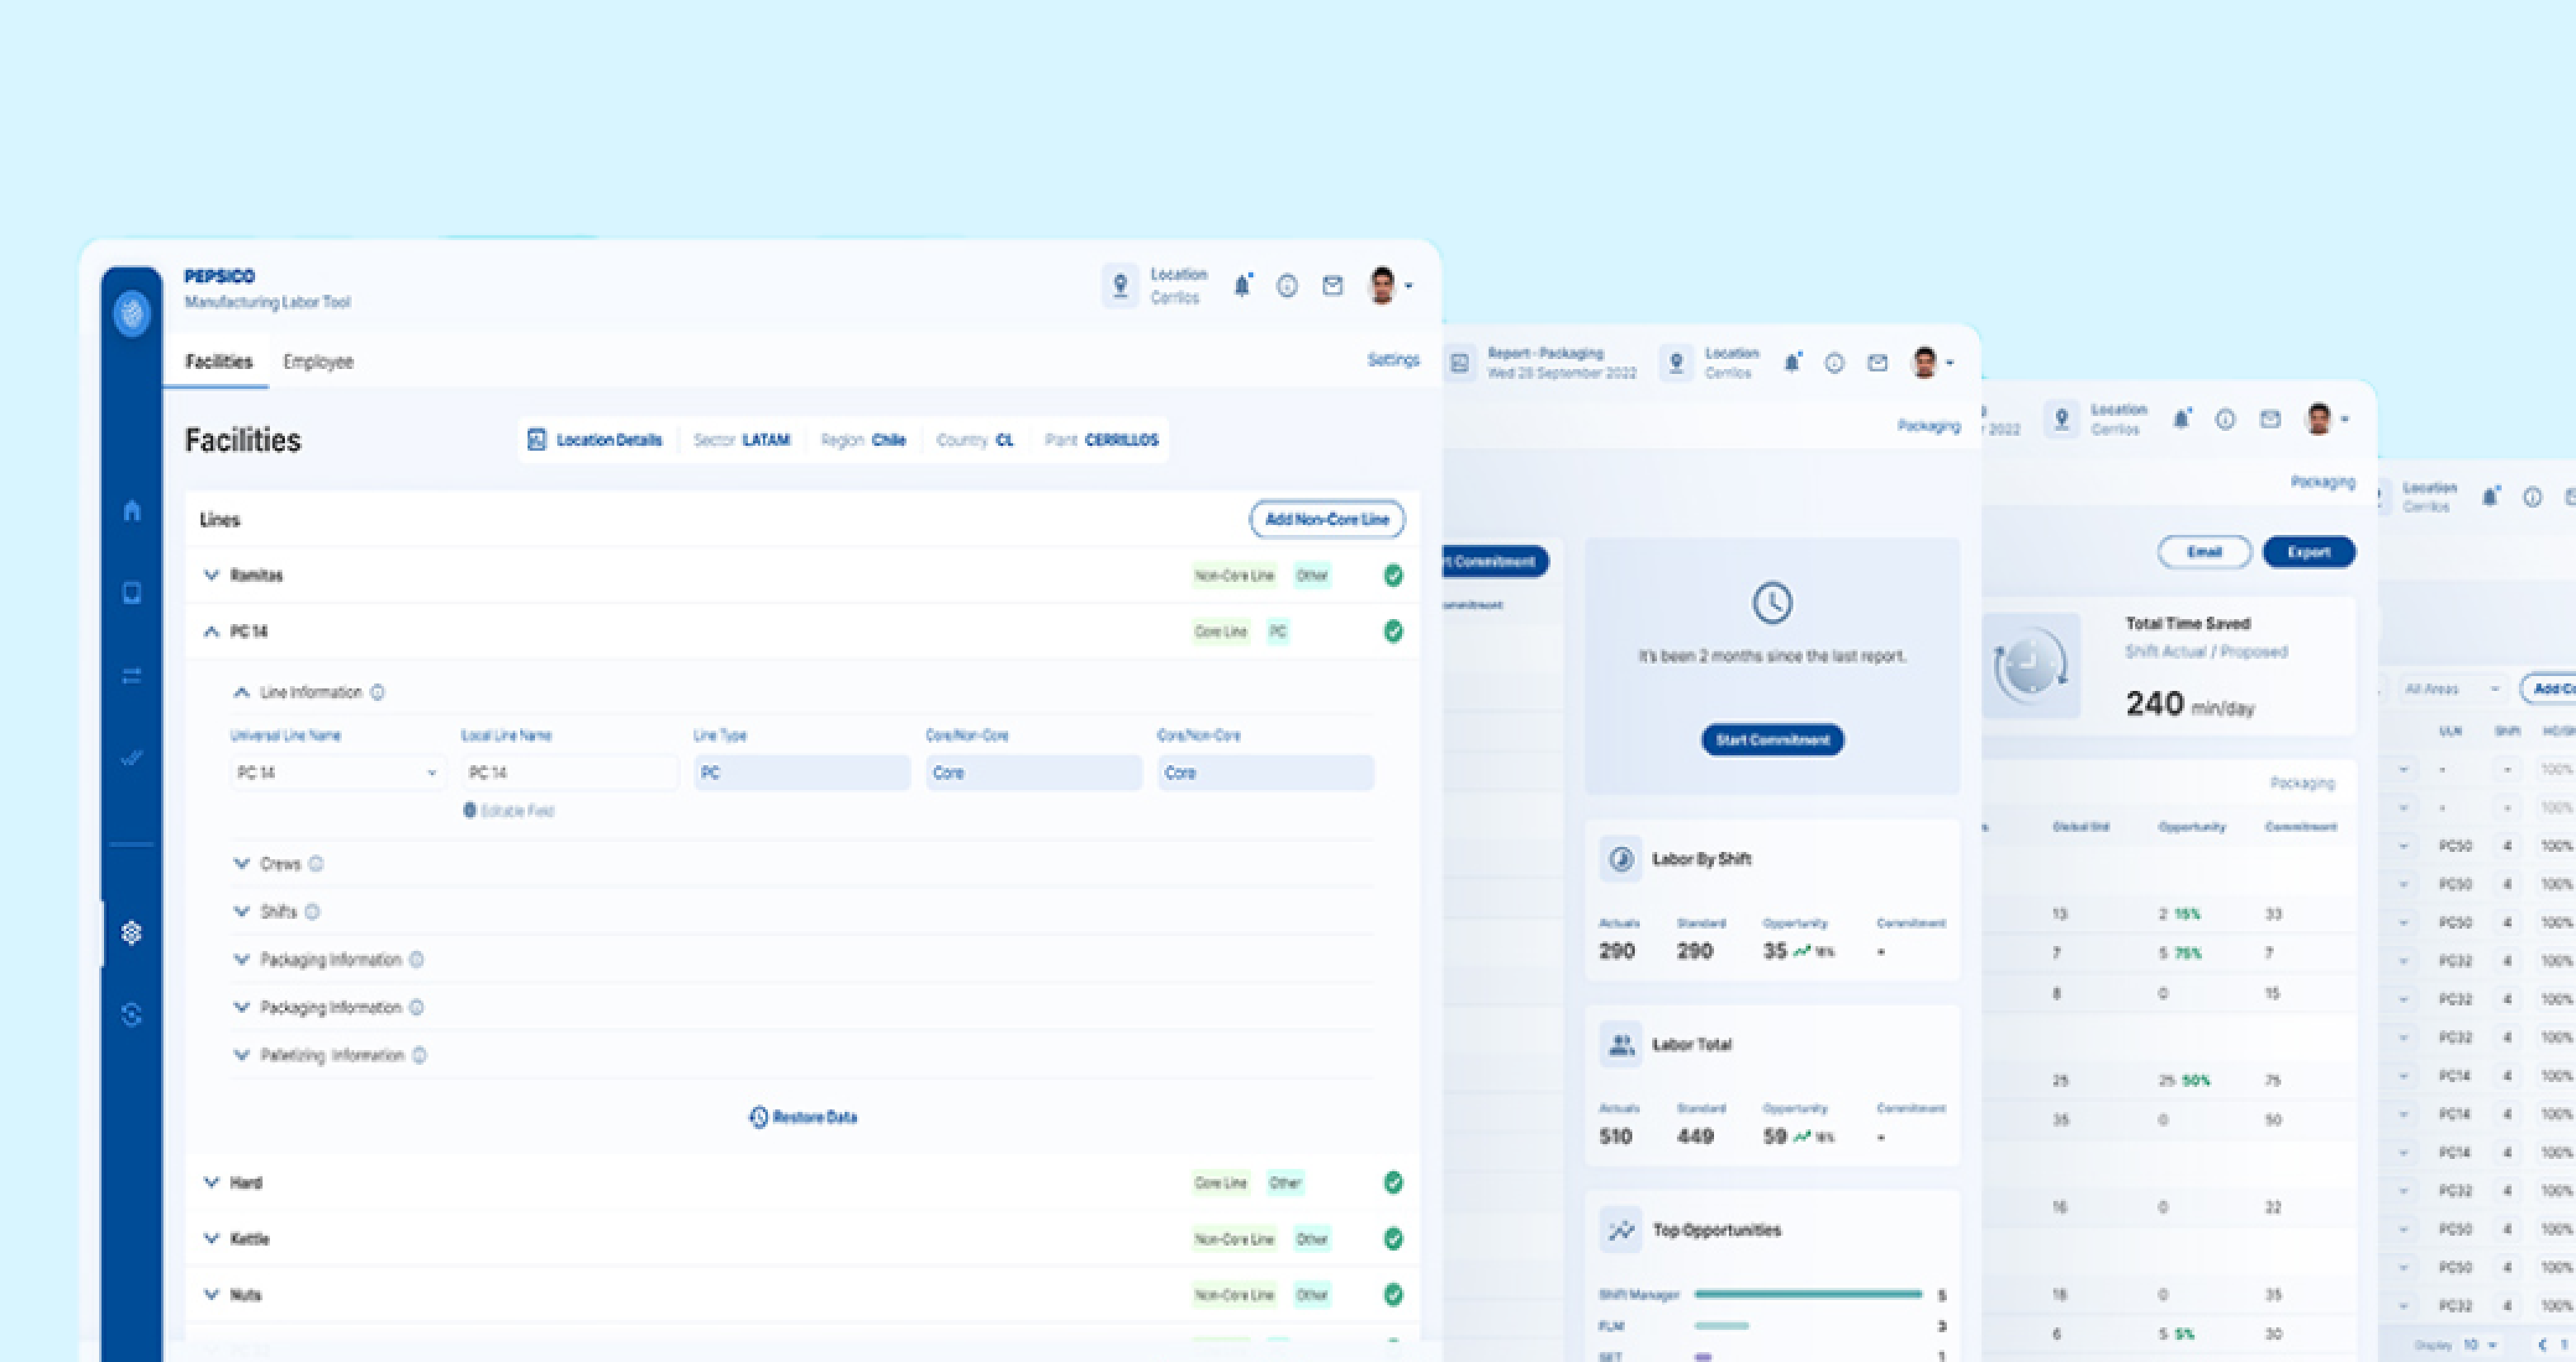
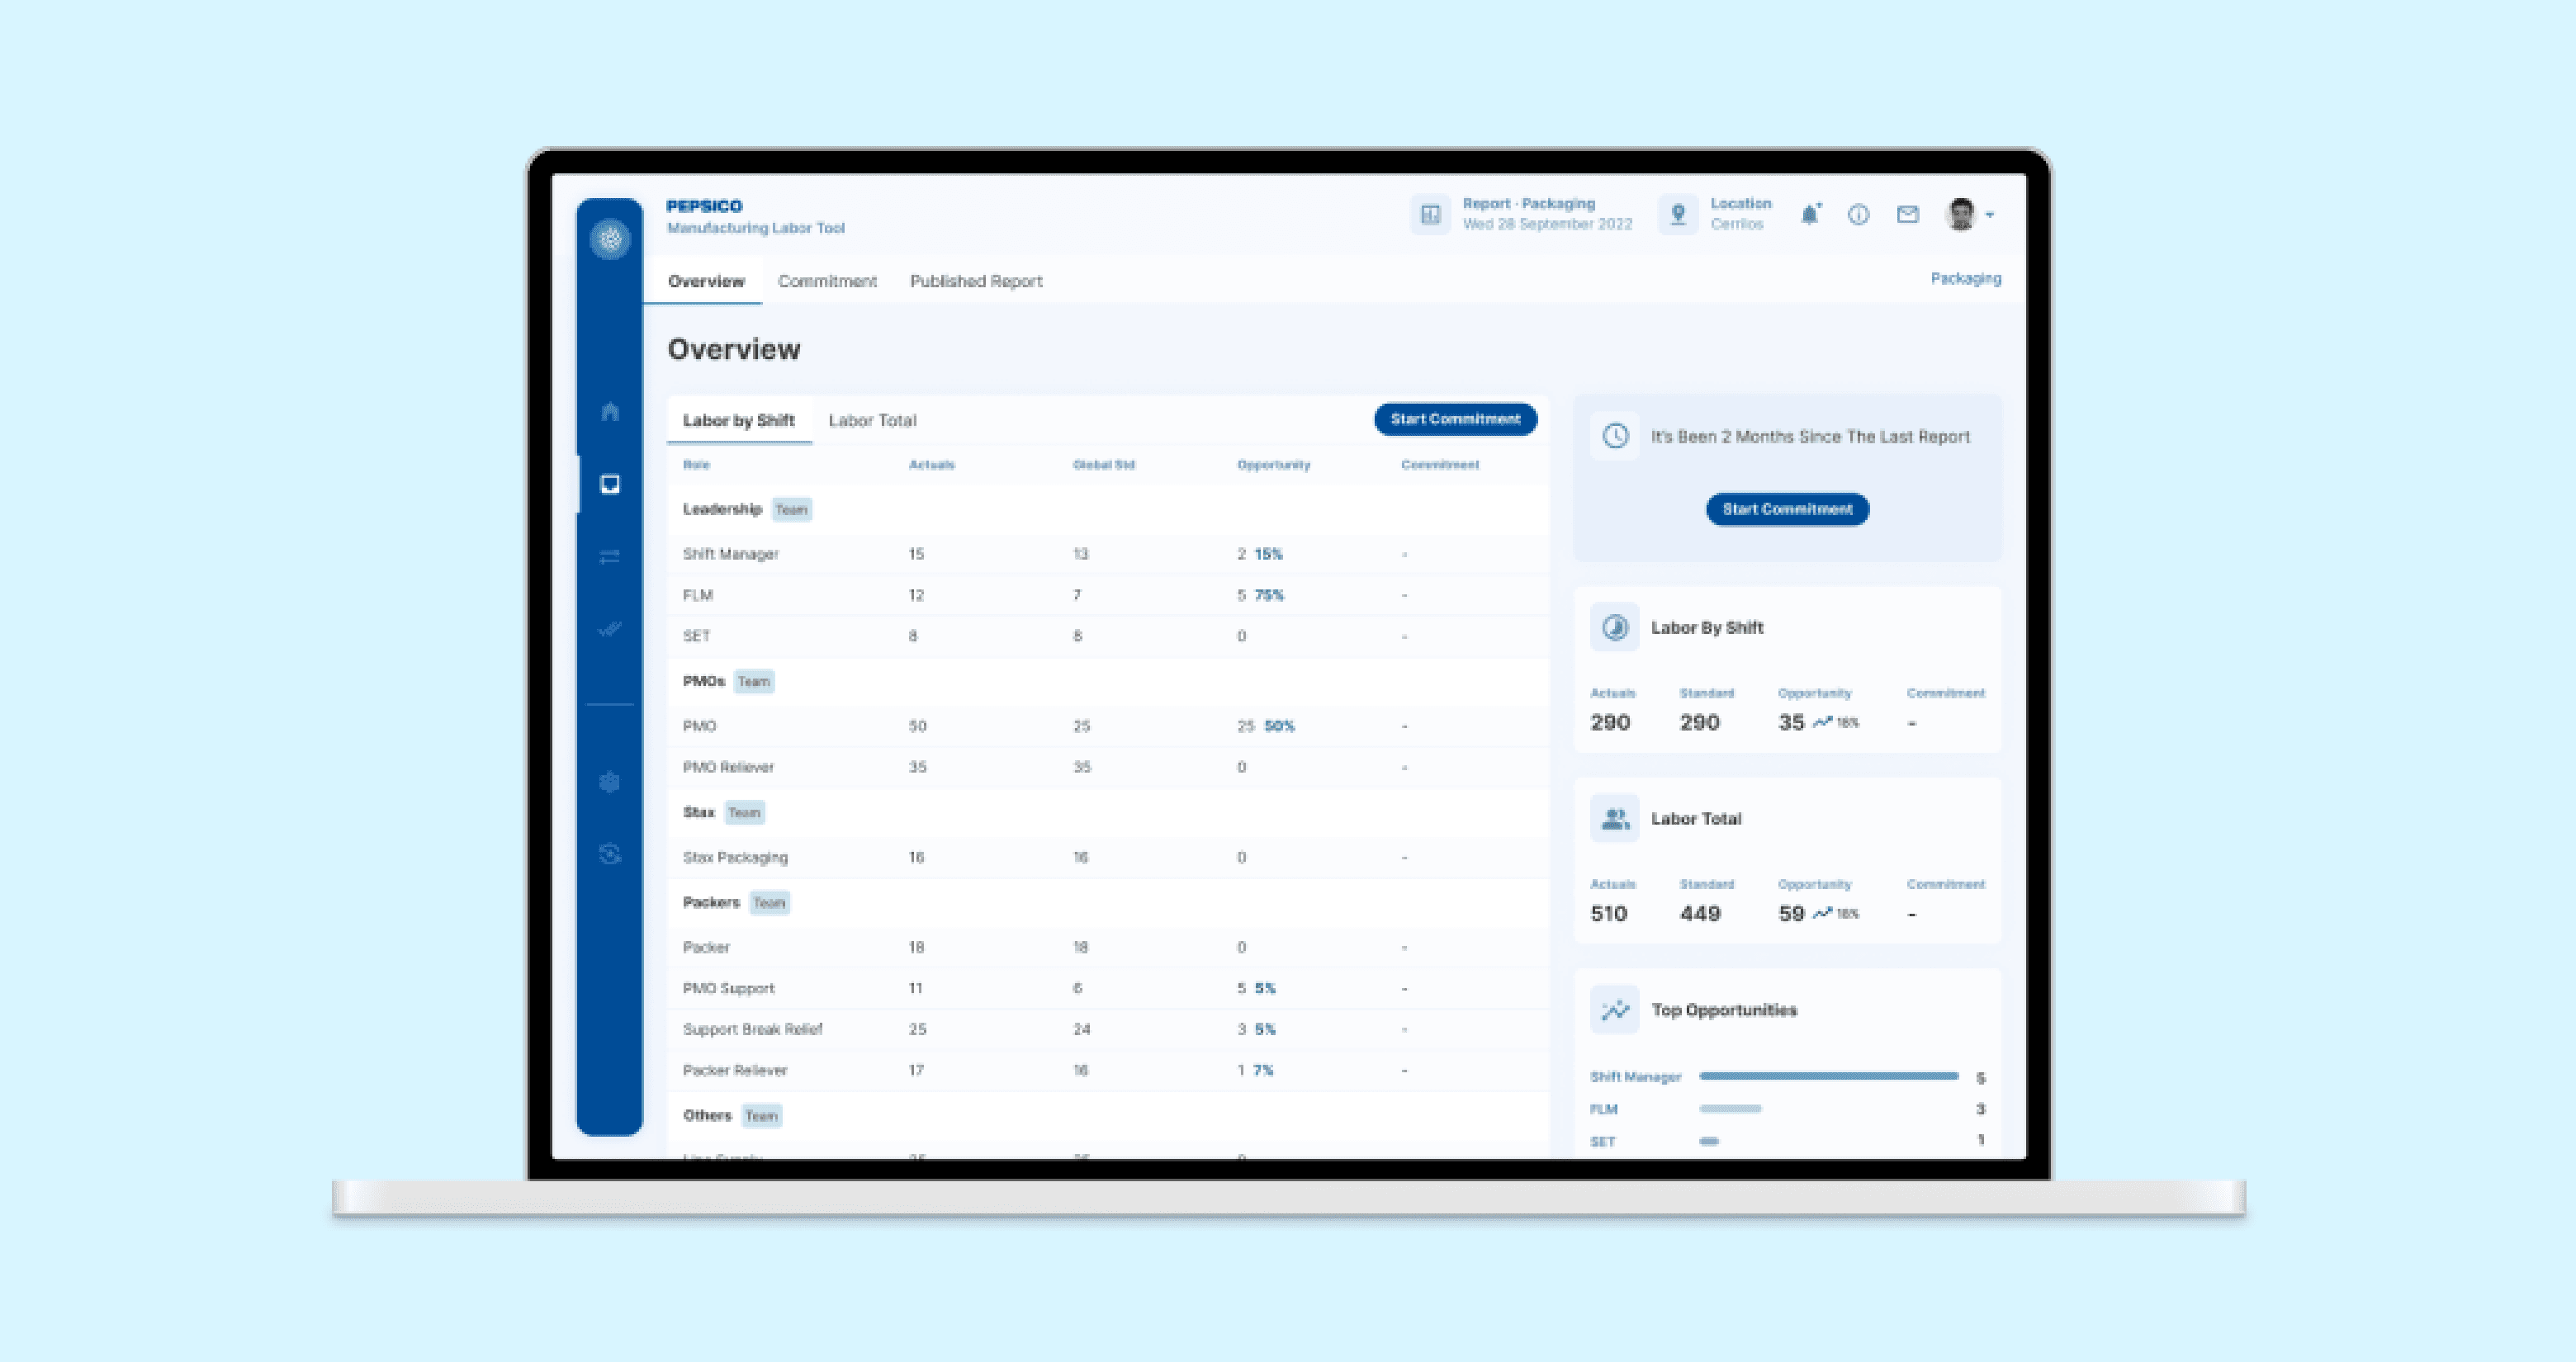
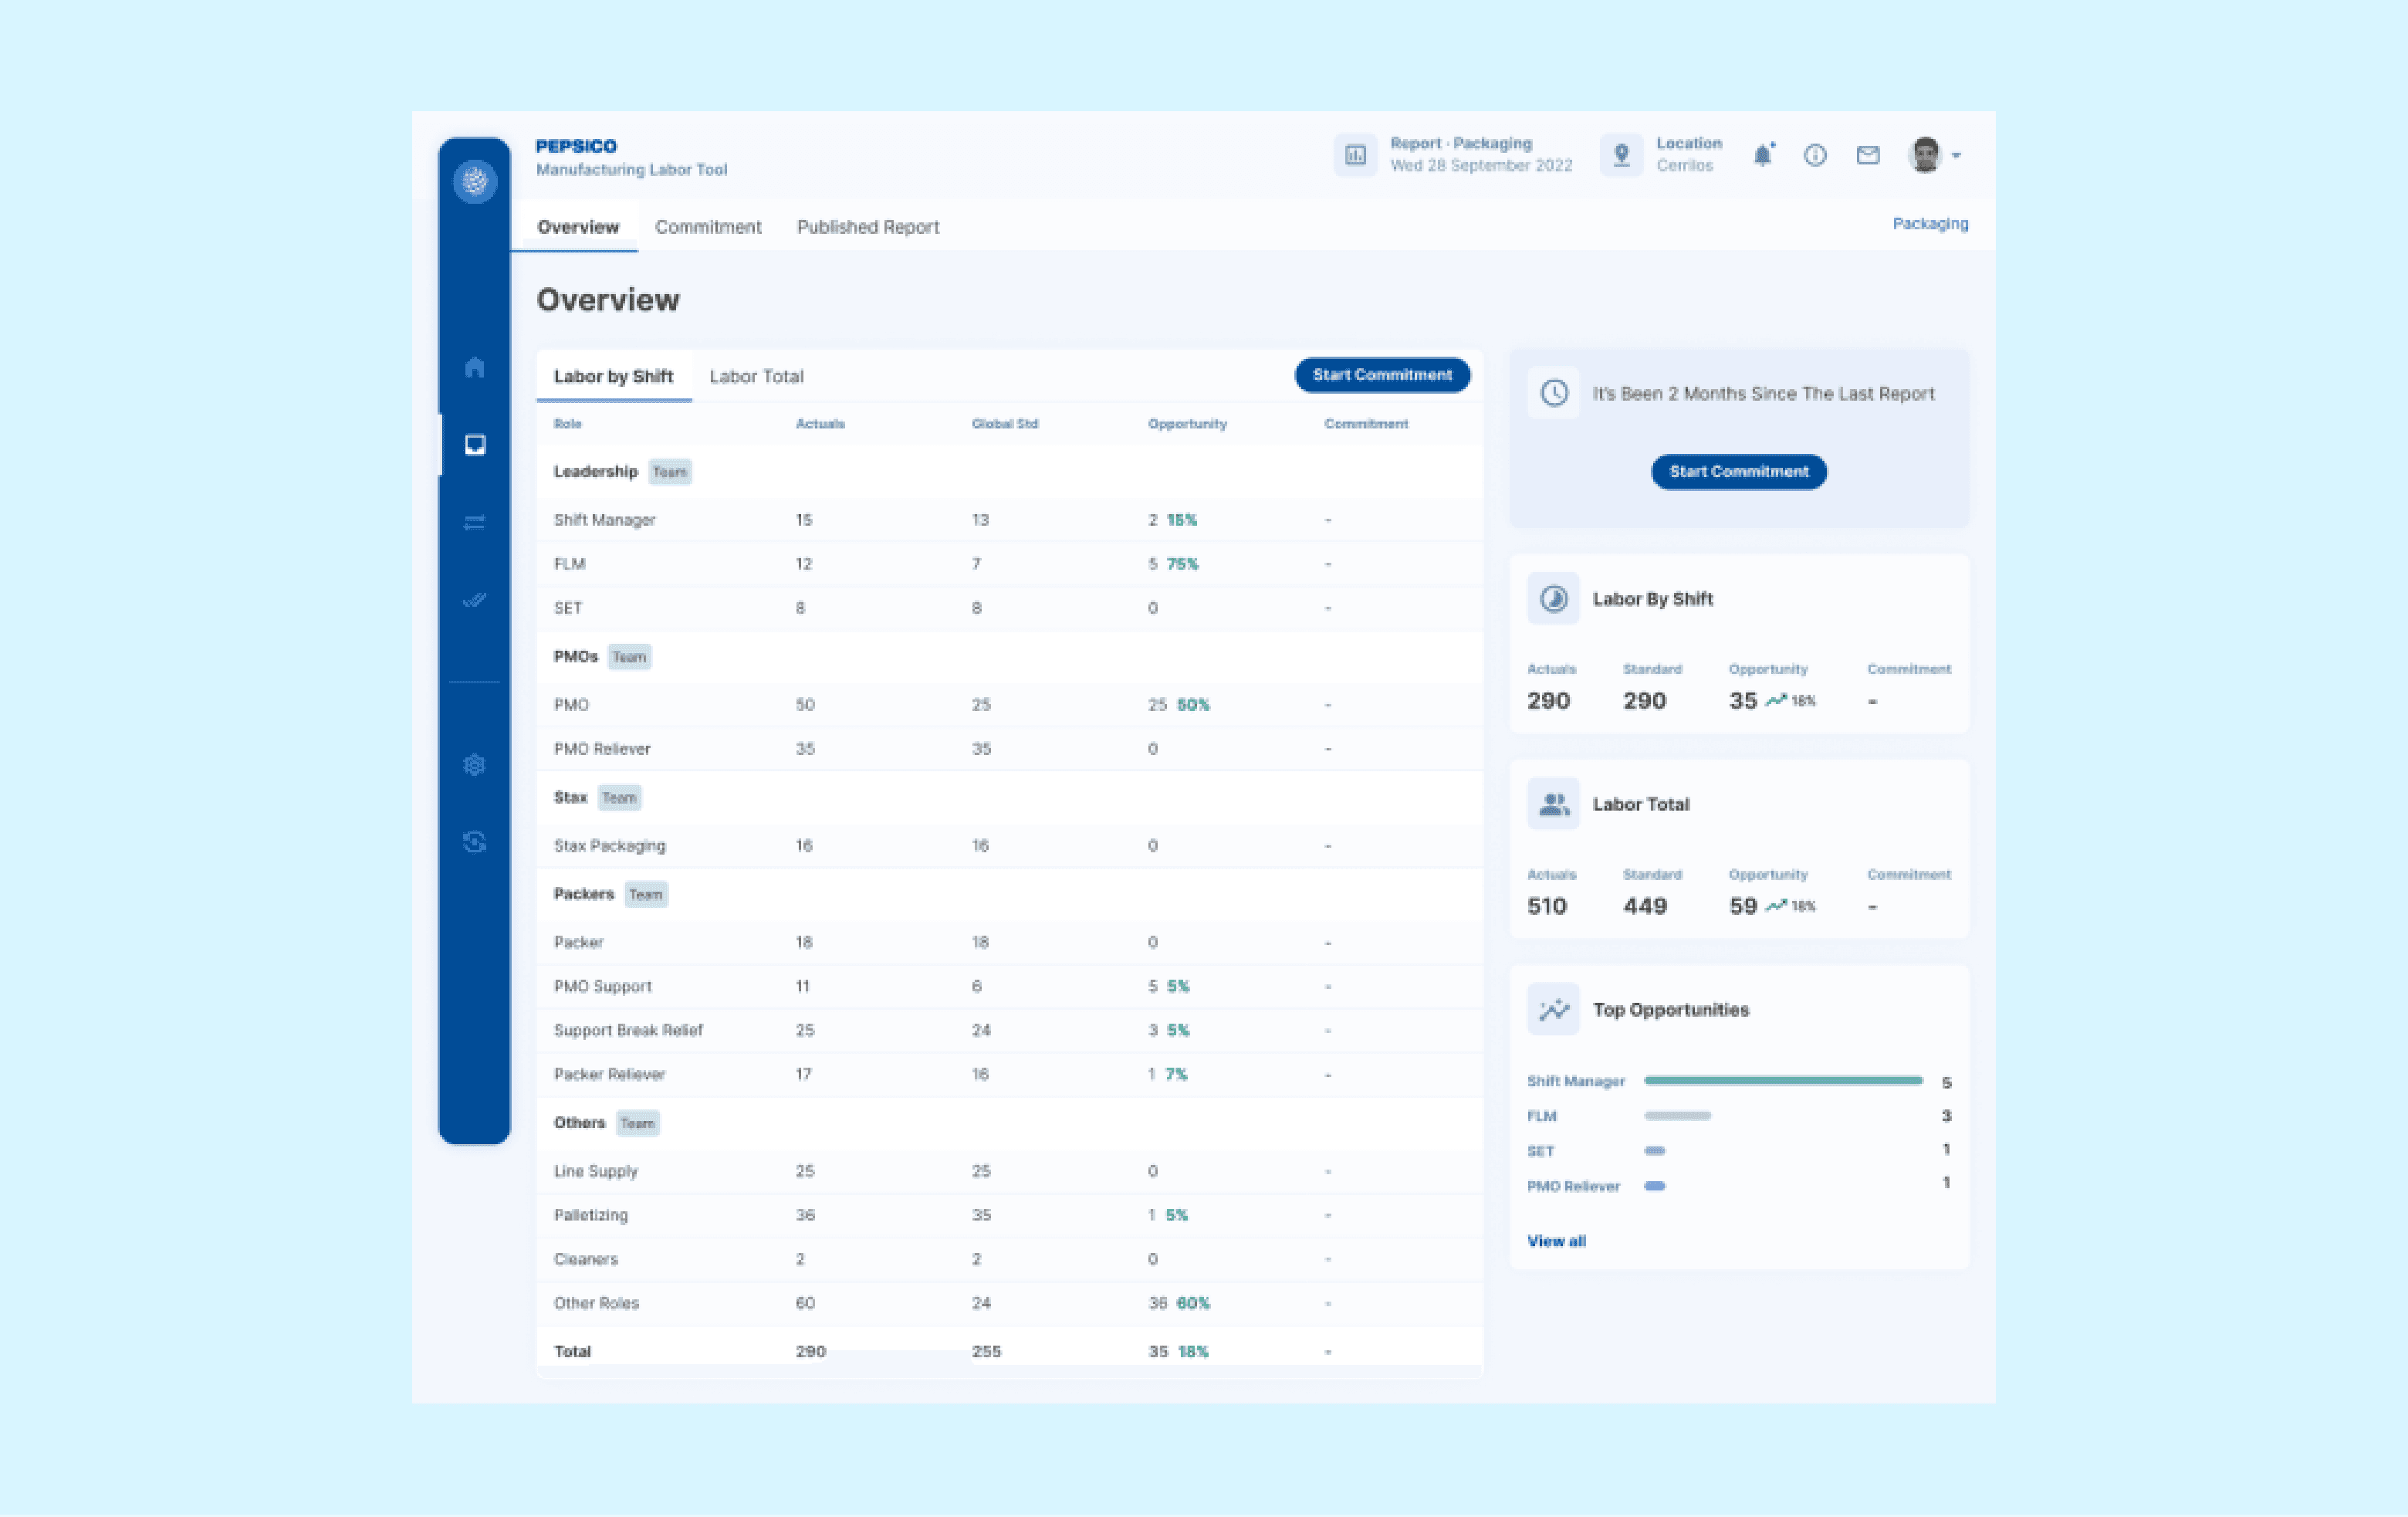
Starting a new report
When starting a new report, users go to an overview page where the main values are shown: the current number of workers (Actuals), the ideal number of workers defined by PepsiCo metrics (Globals Standards), and the delta between these values (Opportunity) and commitment. Before clicking on "Start Appointment" or selecting the menu item for it, this column will be empty. In addition, we present some highlights to help users to be more assertive when starting the activity.
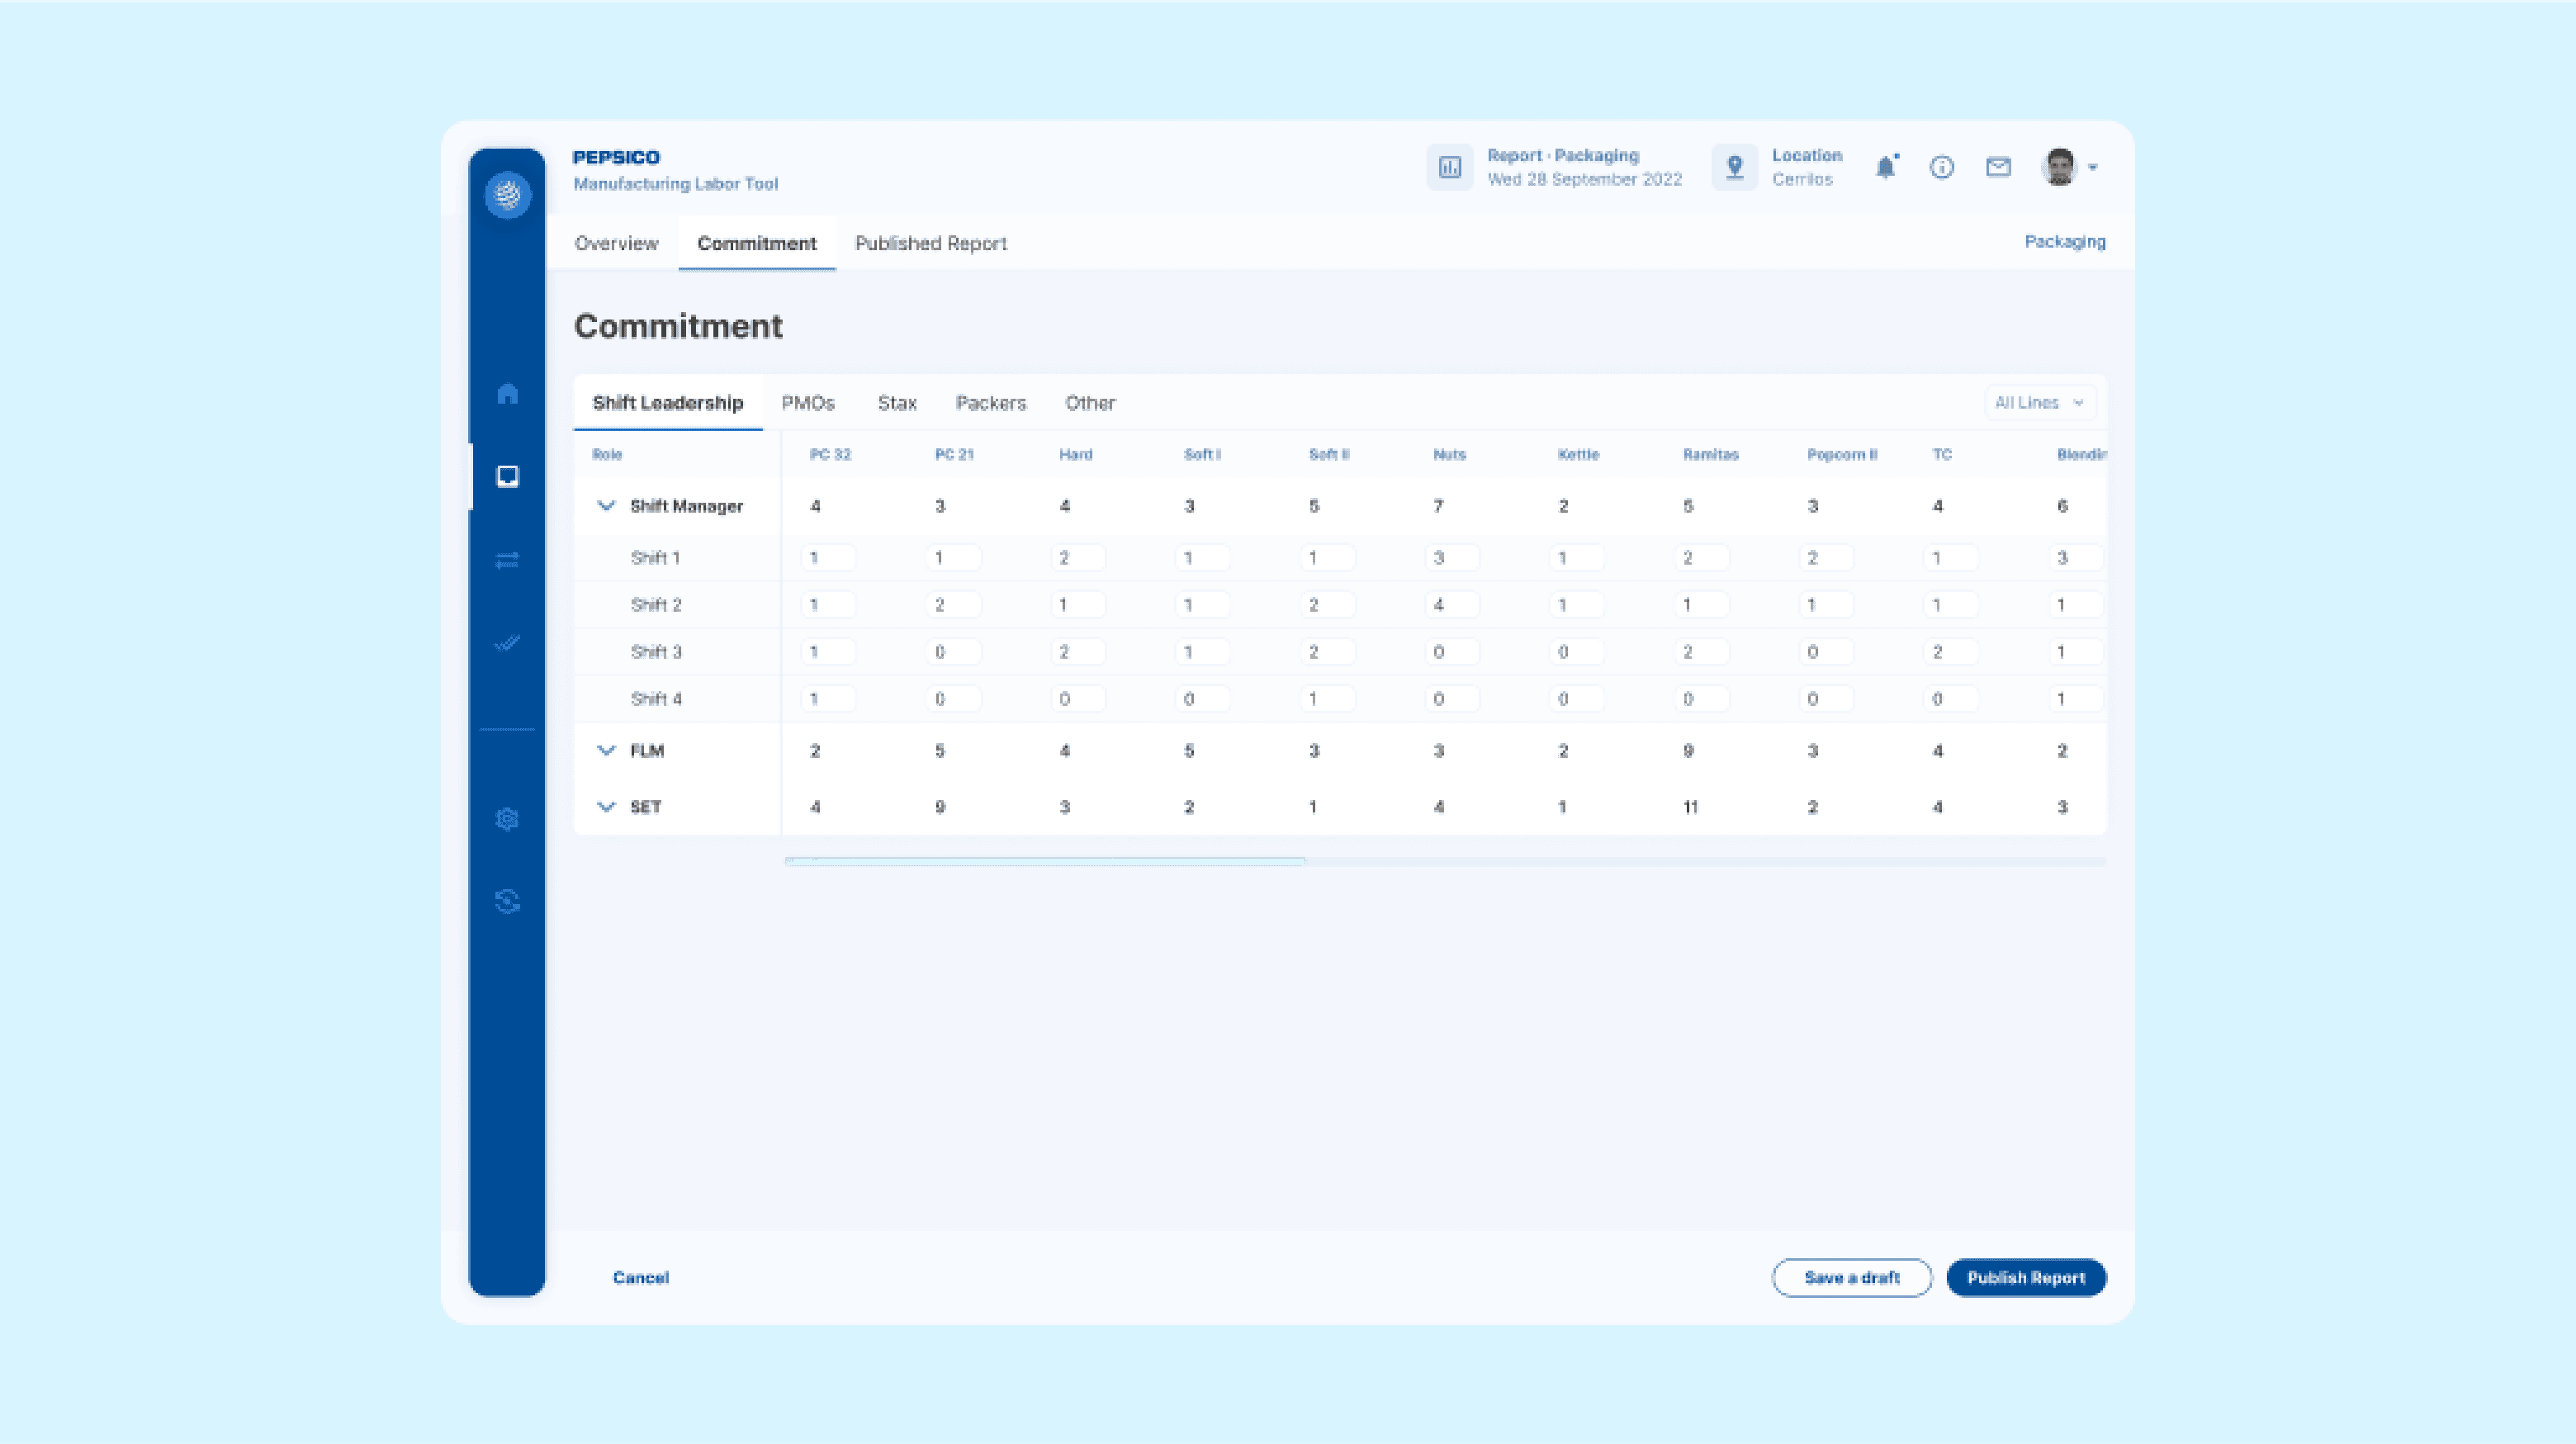
Empowering Productivity: Managing Workforce Allocation and Reporting for Optimal Outcomes.
Commitment is where the magic happens. Users allocate the number of workers on each production line and for each shift. The table is organized by "Teams," and we use tabs at the top to select. The "Roles" column has an expandable row to show shifts, and the parent row is auto-populated with the sum of entered values. Upon completion of work, users have the option of publishing the report, consolidating it, or saving a draft to continue working on later. We've designed a stick bar at the bottom that helps identify these CTAs on pages with long tables.
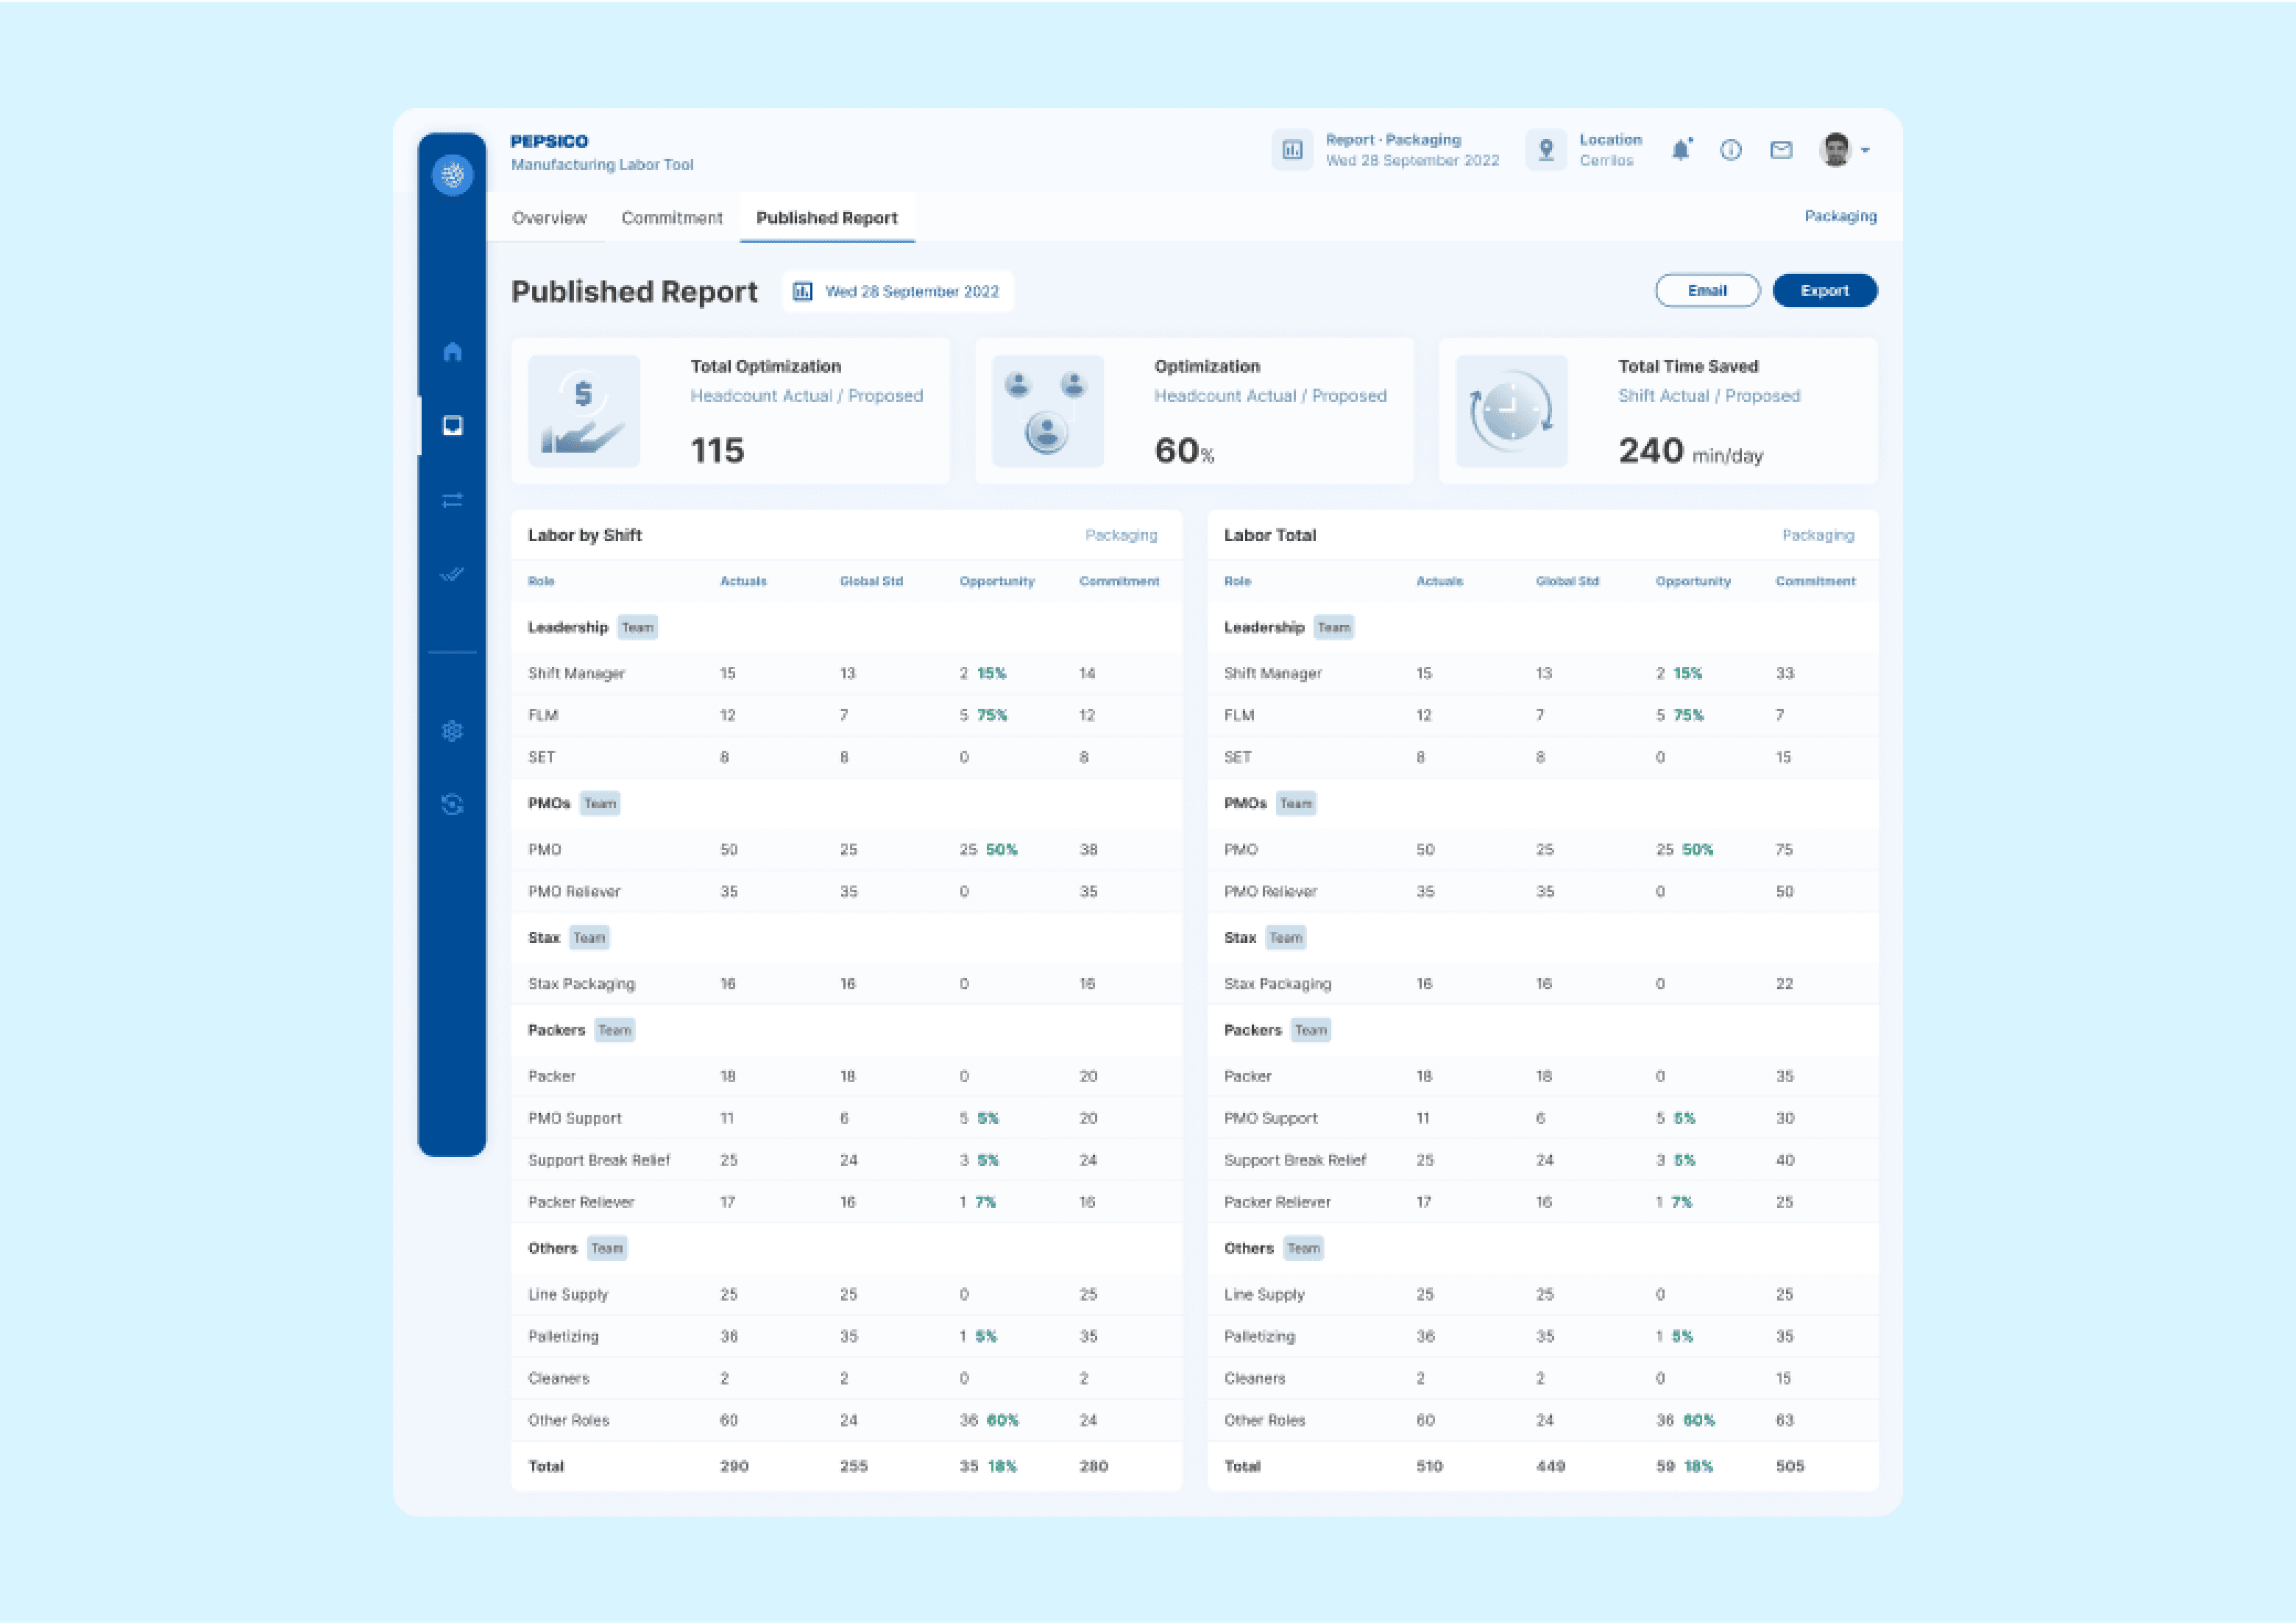
Visualizing Commitment and Metrics with Interactive Ease
Published Report shows the same table of the overview with the commitment column filled. We identified metrics to highlight the impact of the exercise and created cards with illustrations. Users have the option to export to a spreadsheet or to email the report.
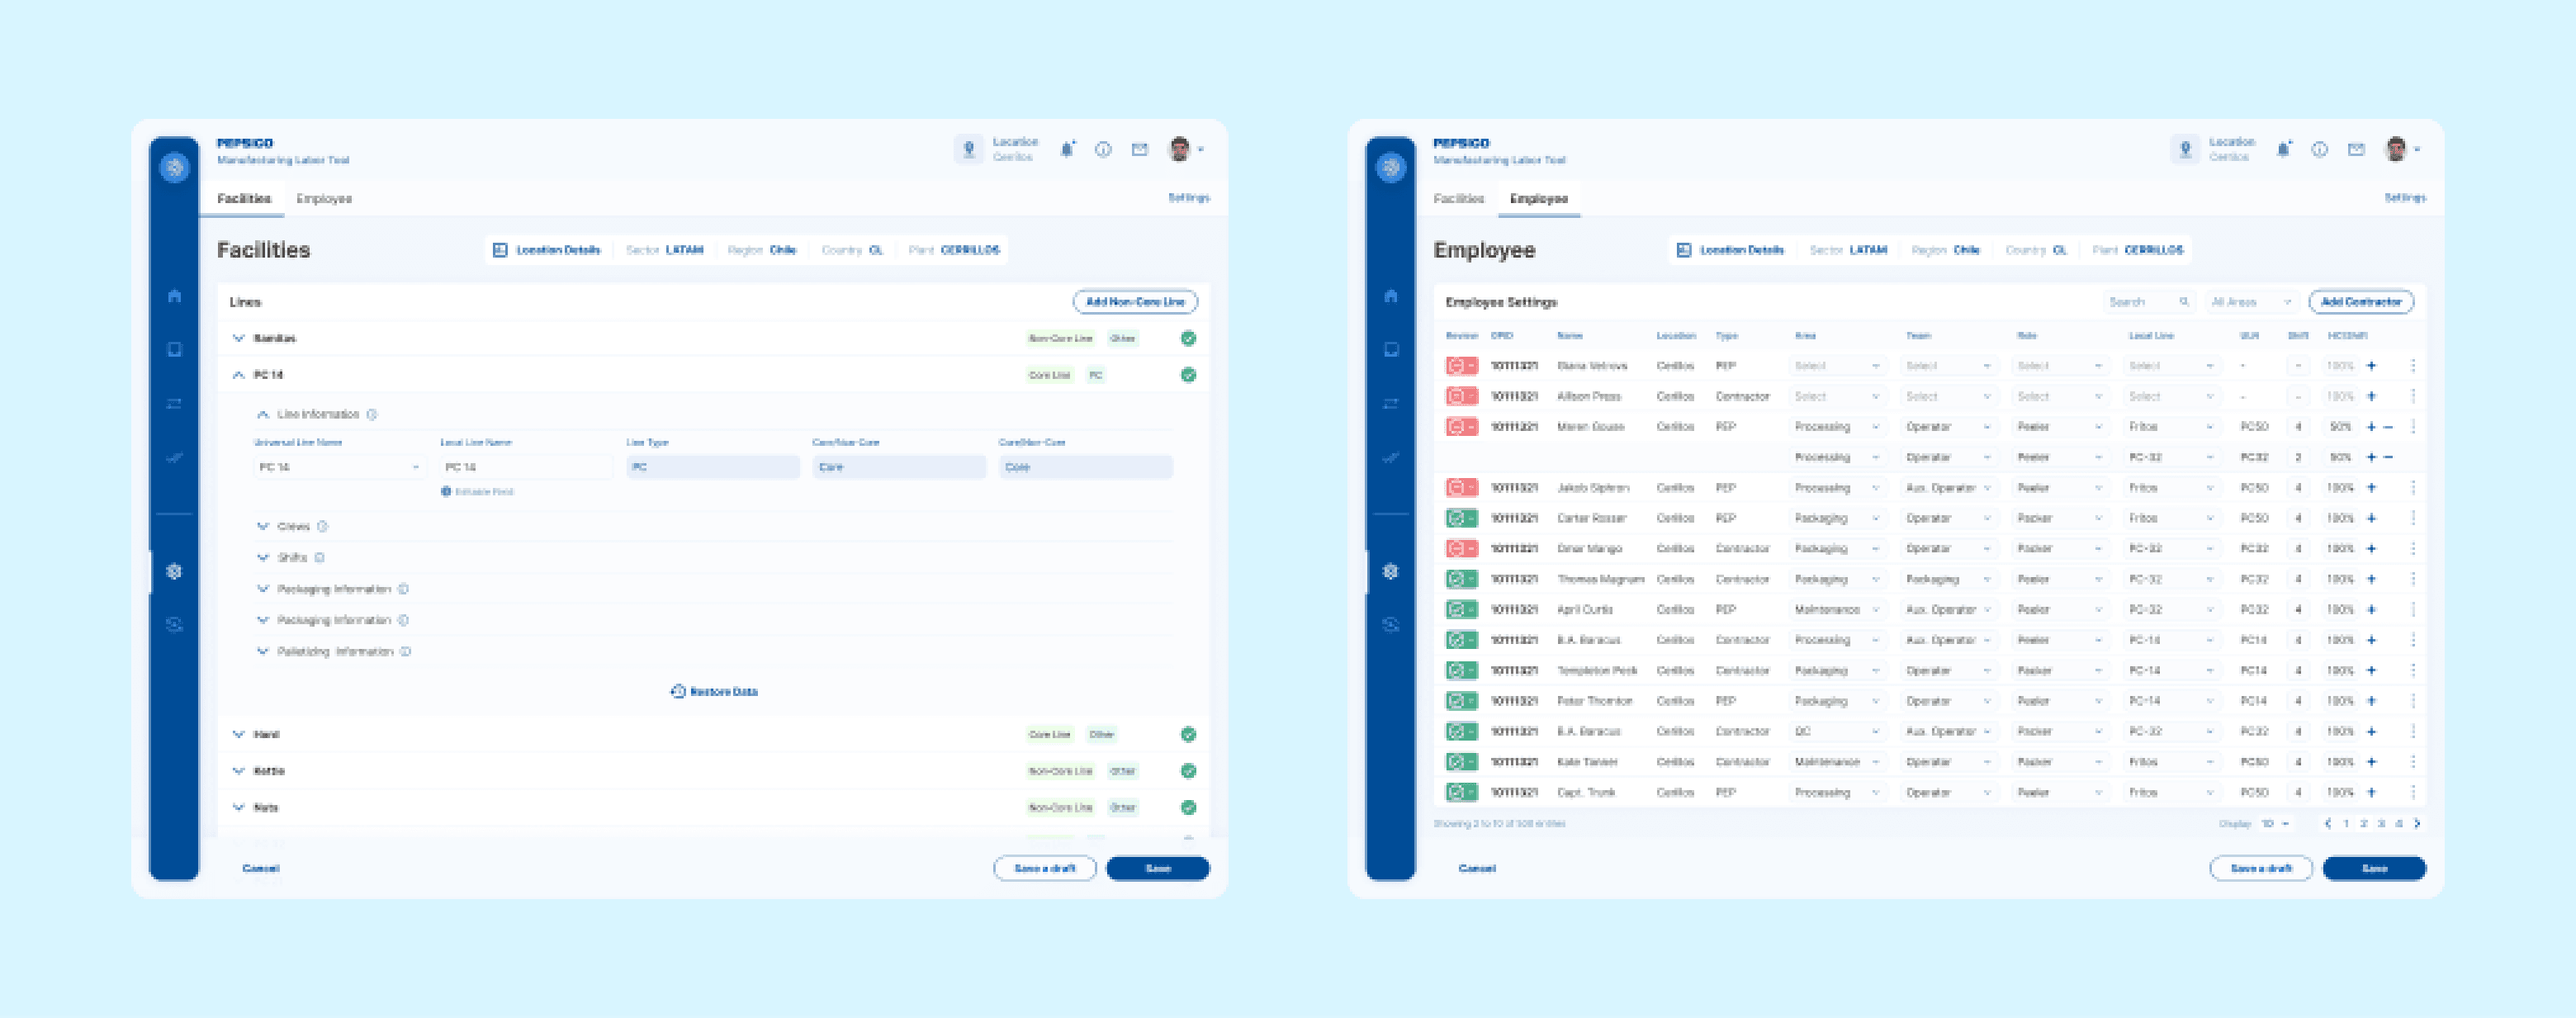
Effortlessly Optimize Production and Staffing with Intuitive User Controls.
On Facilities, users can view production line details and make adjustments for machine type, available shifts, and other specifications. On Employees, managers assign people to a production line and allocate shifts to them. By clicking on the plus icon, a new indented line is created to allow multiple shifts for each employee. All this data will be reflected in the report to be produced for each area.
Conclusion
The Manufacturing Labor Tool MVP was applied to a factory in Chile and after validation aims to be a global app helping global managers identify opportunities and standardize headcount and activities across continents.